EMILI’s Innovation Farms Powered by AgExpert uses Internet of Things (IoT) sensors to influence 4R practices throughout the season.
Monitoring soil moisture helps farmers judge how their crop may perform at different stages in the season. For example, early in the season they can estimate yield, or avoid applying products to a crop that is heat stressed. Later in the season, if a drought event happens during canola bloom for example, a heat blast can occur which causes flowers and pods to drop, resulting in a devastating effect on yield. The knowledge gained from IoT data helps to mitigate these risks.
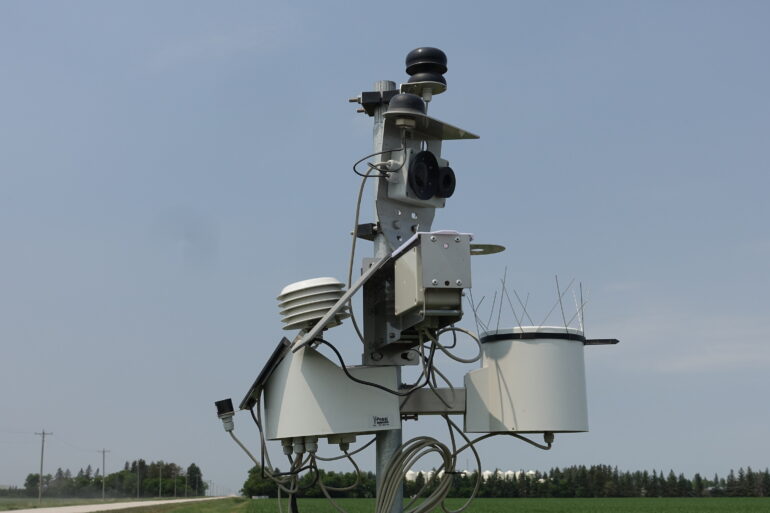
There are seven METOS weather station sensors and seven METOS CropVIEW cameras installed across Innovation Farms. These stations are among 47 IoT sensors placed across the farm to gather and calculate measurements on weather and plant health. The graphs pictured below are accessible through an easy-to-use Metos FieldClimate app that the Innovation Farms team has installed on their smartphones and computers.
IoT data informs 4R practices
Early in the season before seeding, soil moisture and temperature data helps farmers determine optimal seeding time. This insight makes it easier to implement 4R practices (Right Time and Right Place) to reduce emissions and fertilizer loss, while also increasing plant nutrient uptake.
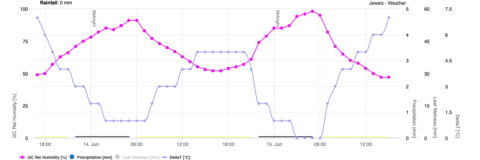
Insights on wind direction and speed

The black dots in Graph 1 indicate wind direction. This information is helpful during spraying. It lets farmers know if there is a risk of drifting chemicals onto a nearby field. The dark green line indicates wind speed, letting us know if it is too windy to spray (or too windy to fly a drone).
Insights on temperature and humidity
The violet line in Graph 2 represents Delta T (°C), which is the survivability of a droplet once it leaves a spray boom as governed by temperature and humidity. A higher Delta T means faster water evaporation, while a Delta T between 2-10 °C is a good spray window.
Insights on likelihood of frost
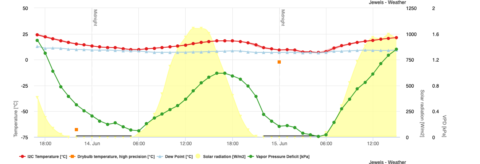
The light blue line in graph 3 represents dew point (°C). If the dew point dips below freezing, it can indicate the likelihood of frost. This provides vital insight into a farmer’s ability to seed after the danger of frost has passed.
Insights on temperature, moisture, and salinity of soil

Graph 4 provides insight into a probe that is 120 cm long, with sensors every 10 cm. A probe of this depth is highly beneficial in irrigation systems to track water in the soil. For example, the light orange sensor at 10 cm tells us that there is only 13% Volumetric Water Content (VWC) which happens when there is no rain. In fields without irrigation, a probe of this length provides farmers with important insights into temperature, moisture and salinity of soil at multiple depths.
New perspectives on crop health and yield
The graphs highlighted above provide a snapshot into the insights we are gathering from weather stations and soil moisture probes on a daily basis to inform decision-making.
The information from these sensors, and other sensors across Innovation Farms aids us in making more productive, sustainable decisions throughout the season. This information will be used to guide the industry toward economically and environmentally resilient practices that empower growers and others along the value chain to adopt and fully deploy digital tools.